
RealDataIQ
See every force. Understand every impact. Share the insight immediately.
we turn the lights on
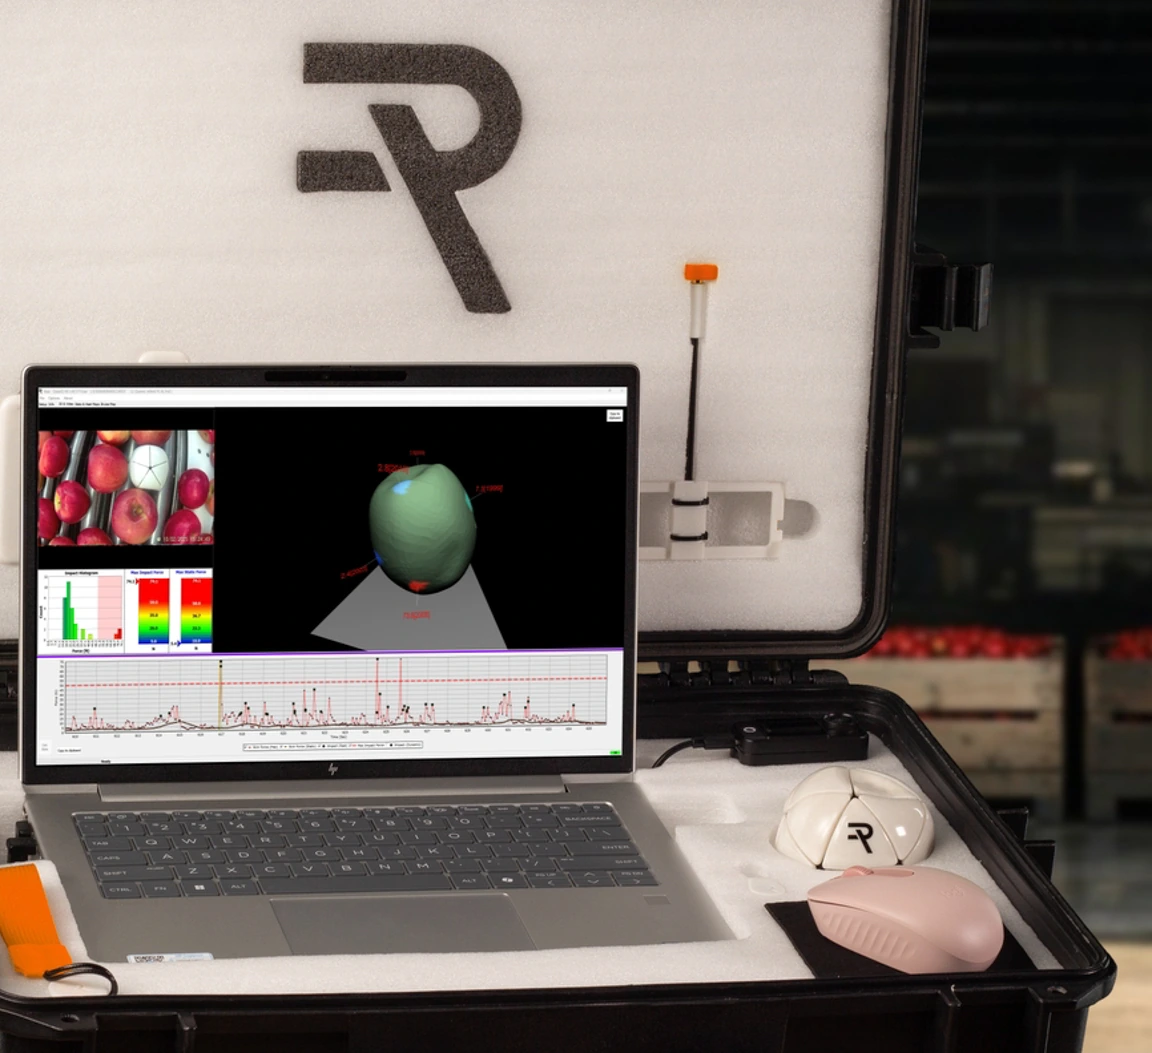
RealDataIQ™ is the analysis engine and viewer. It assembles and displays the massive data file together with the video. This turns a measurement run into a visual experience that any decision maker can understand — and act on — immediately.
Every impact. Exactly where it happened.
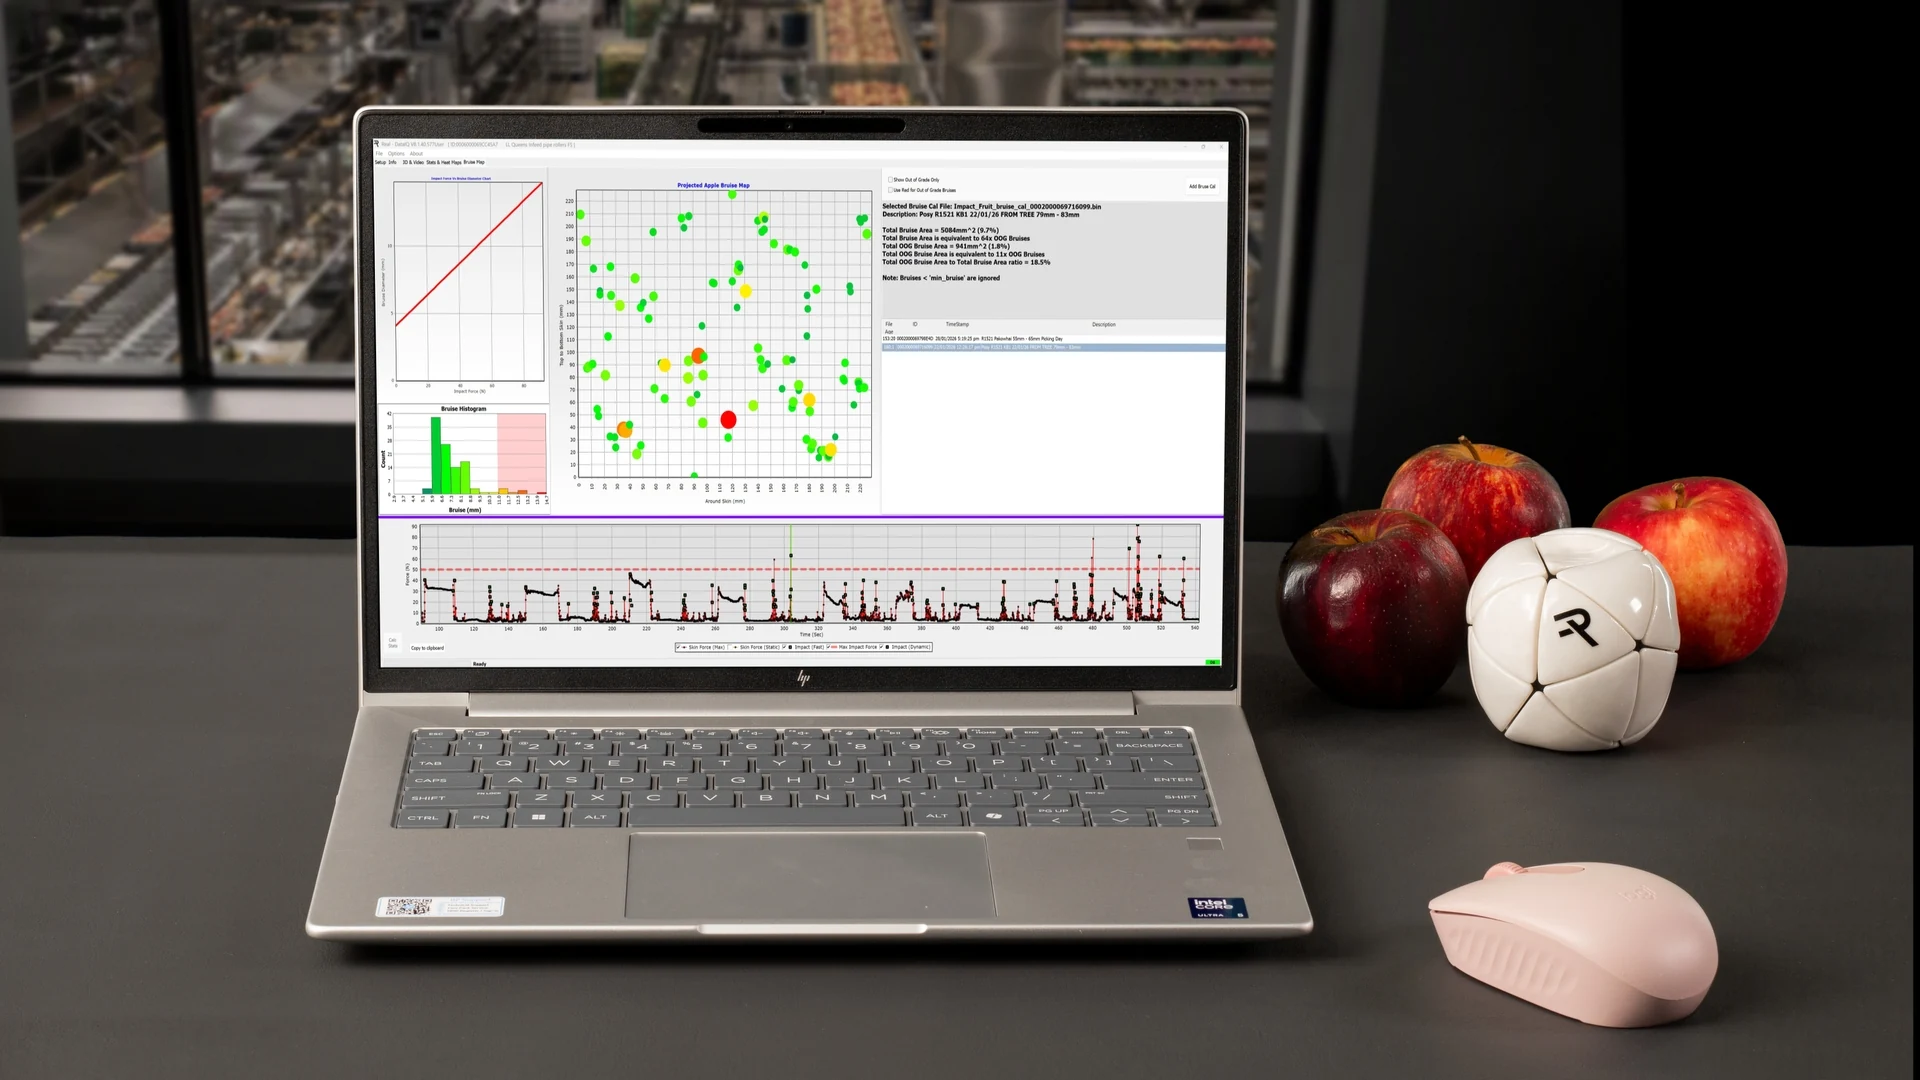
When a measurement run is loaded the user can access multiple graphic and visual representations of the force and positional data. A 3D model of the RealAppleIQ™ instrument moves, rotates and displays colored force data. The heatmap is a world-map-style display showing all recorded impacts across the full surface of the instrument, sized by force magnitude. This is where bruise sizes are displayed, derived from your actual RealBruiseIQ data. At a glance, you can see which zones of the apple are taking the most punishment — and the size of actual bruise. Every graphic, histogram and metric can be copied from the app straight into your preferred reporting template.
Learn More
Click the spike. Watch it happen.
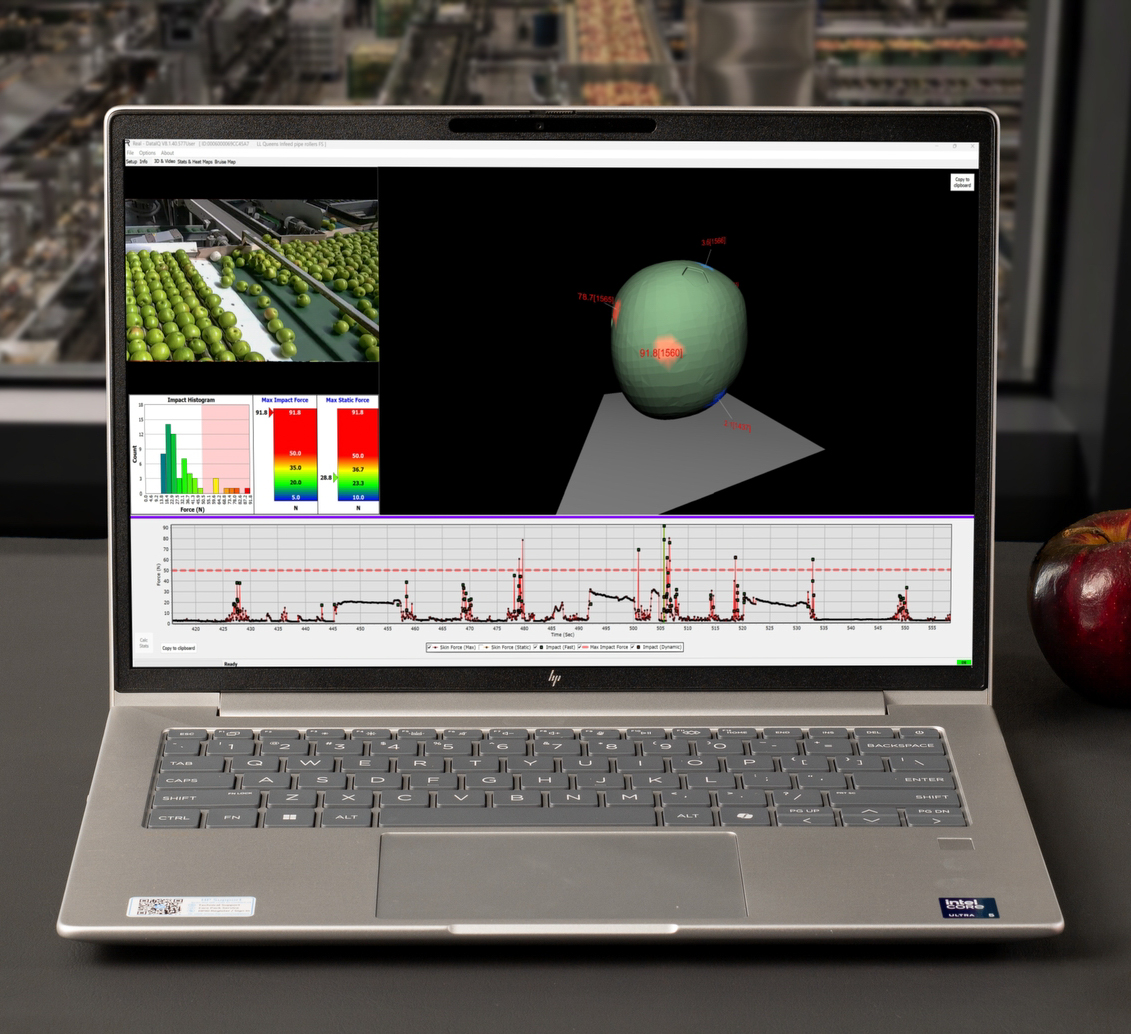
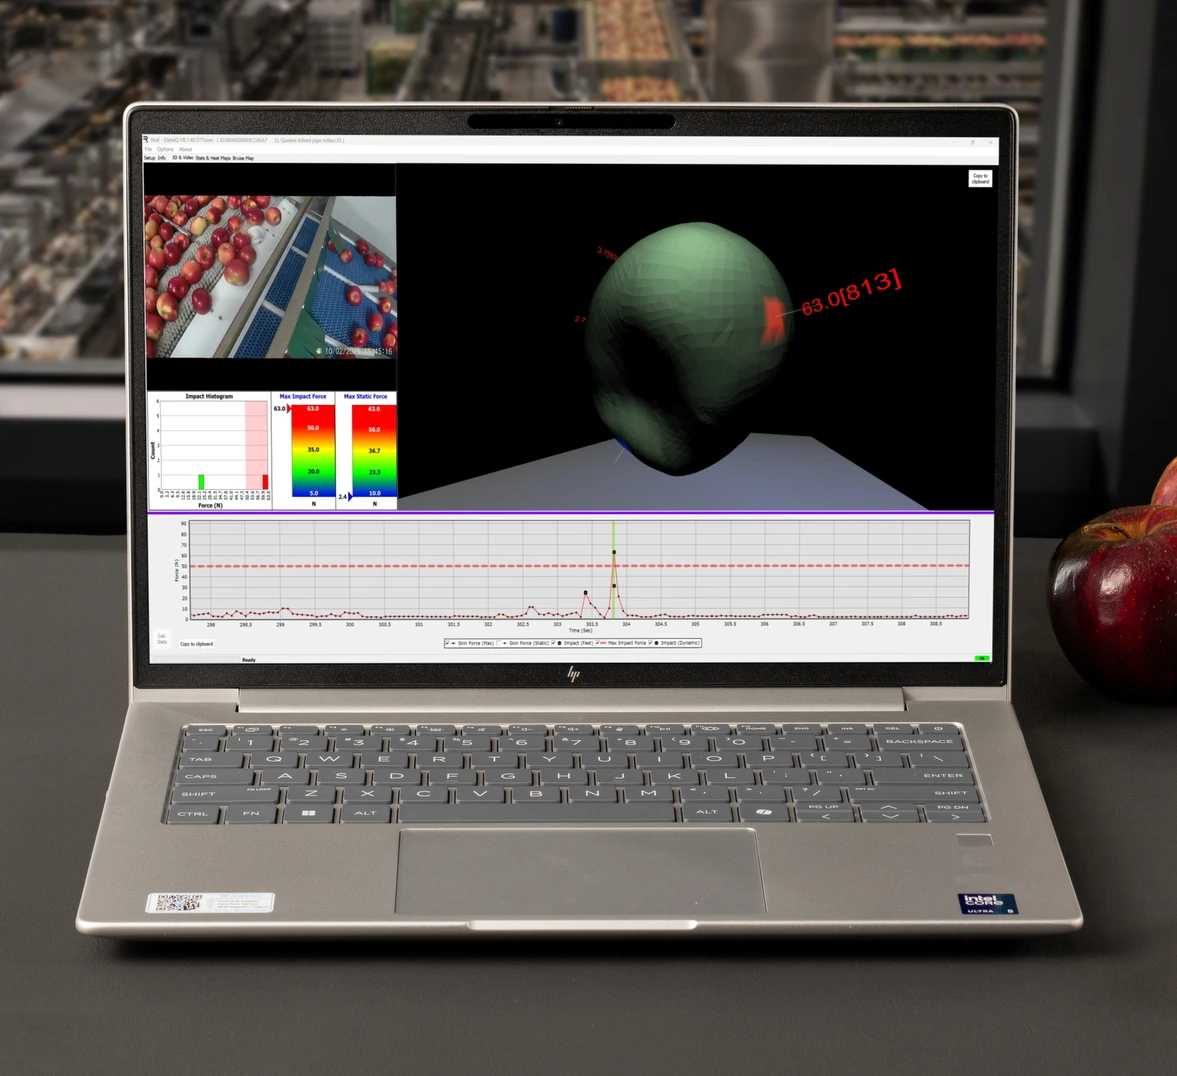
Every measurement run includes synchronized video captured alongside the sensor data. In RealDataIQ™, the video plays in real time as the data plays. Zoom in on any spike, in any chart and the video immediately jumps to that moment. Zoom into a single impact and every display updates: the 3D model holds the orientation at that moment, the force charts zoom in, the histogram recalculates. Or zoom out to the full run and watch the entire session play through. The data and the video are always in lockstep. When you watch an impact happen on video and simultaneously see the force on the 3D model and the severity on the histogram, the cause of damage becomes unmistakable.
Learn More
One link. Every stakeholder. Full understanding.
Once the insight is clear, sharing it takes one step: send a link to the measurement run. Anyone in your organization gets immediate access to the complete run on their own device, and from there they're in control. They can play the video, zoom into the data, and replay any force event as many times as they need, building their own understanding. That matters because decision makers who've seen the data for themselves — the video, the force on the 3D model, the histogram — move faster and decide with more confidence. Aligning calendars for a meeting can take days. Sending a link takes seconds.
Learn More
The fastest way from measurement to change.
Real Instruments Limited — Turning the lights on in apple handling.
Contact Us